14.DEMOGRAPHY
#space/ap-geography/demography
-
Andhra Pradesh is the {{10}}th most populous state in the country with a population of {{4.95}} crores accounting for {{4.09}} percent of the country's population.
- According to the 2011 census, population indicators are below. It was reported that there are{{ 2}} million cities in the state. They are Vijayawada and Visakhapatnam.
- The famous Archaeologist Robert Bruce Foote studied in the Balloon Caves at Bethancherla in Nandyala district On the basis of artifacts and human wandering in Andhra Pradesh first identified in the Nallamala hills between Dornakallu - Atmakur. According to historians, It seems that there is the Andhras and Aryans who are believed to be a tribe called {{Nagas.}}
- The efforts of conducting population census in the country goes back to {{1872}}. But it is not regarded as regular census. The first systamatic, synchronous census is said to be conducted since {{1881cue-BI- British India}}. After that, India has conducted decennial census {{without any}} {{interruption}}.
- The provisional figures of India's largest Census {{2011}} were released in New Delhi on 31st March 2011 by Union Home Secretary{{ GK Pillai cue-Home(Home secretary) lo unna Pilla(pillai) Restrict(Registrar) Cigarettes'(mouli) and Mandu( mouli) }} and RGI (Registrar General of India) {{C. Chandramouli. cue-Home(Home secretary) lo unna Pilla(pillai) Restrict(Registrar) Cigarettes'(mouli) and Mandu( mouli) }}
- The motto of census 2011 was '{{Our census, Our future}}.
- Census 2011 is the {{15}}th Census of India since 1872 and {{7}}th Census after Independence.
- According to 2011 census A.'s population is {{4,95,77,103}}. It constitutes {{4.09}}% of india's Total population.
- AP occupies {{10}}th place among the highly populated state's of India.
- Average population density of the state is- {{304 cue-304-mn}}/Sq. km
- The decadal growth rate of Population (2001-11) in the state is {{9.21}}%.
- Kurnool district has the highest growth rate with {{14.85}}% and West Godavari district has lowest with {{3.51}}% (Excludes merged village of Khammam).
- Scheduled caste : As per 2011 census the percentage of Scheduled caste in our state is {{17.08}}. These people settled in some districts more than the states average. Scheduled castes population in our state is concentrated largely in {{Prakasam}} district (Percentage wise) their percentage is 23.19 in this district.
- Scheduled caste Population is predominantly concentrated in {{Guntur}} district.
- Out of the total scheduled caste population of {{84,45,398}} in the state.
- Scheduled Tribes: Most of scheduled tribes of A.P live in {{Visakhapatnam}}. in terms of percentage ({{5.53}}%) also {{Visakhapatnam}} is the leading district.
- {{Kadapa}} is stands at last position in respect to ST's population.
Fact file of population in A.P
- Total population {{ 4,95,77,103}}
- Total Male population - 2,48,30,513 ({{50.08}}%)
- Total Women population - 2,47,46,590 ({{49.92}}%)
- Total Rural population - 3,49,66,693 ({{70.5}}3%)
- Total Urban population - 1,46,10,410 ({{29.47}} %)
- Population density - {{304}} (per sq.km)
- Total child population - {{52,43,636}} (0-6 years age)
- Male child population - {{26,97,015}} (0-6 years age)
- Girl Child population - {{25,46,621}} (0-6 years age)
- Total literates age - 2,98,59,982 ({{67.35}}%)
- Total male literates - 1,65,49,514 ({{74.77}}%)
- Total women literates 1,33,10,468 ({{59.96}}%)
- SC. Population - 84,69,278 ({{17.08}}%)
- S.T. Population - 27,40,133 ({{5.53}}%)
1) Population
- highest
- lowest
? - Highest
- East Godavari
- Guntur
- Lowest
- Vijayanagaram
- Srikakulam
2) Population Density
?
- Highest
- Krishna
- West Godavari
- Lowest
- Kadapa
- Prakasam
3) Decadal population Growth Rate
?
- Highest -
- Kurnool
- Anantapuram
- Lowest
- West Godavari
- Vijayanagaram
4) Men population
?
- Highest
- East Godavari
- Guntur
- Lowest
- Vijayanagaram
- Srikakulam
5) Women population
- high
,- low
? - Highest
- East Godavari
- Guntur
- Lowest
- Vijayanagaram
- Srikakulam
6) Sex Ratio
?
- Highest
- Vijayanagaram
- Srikakulam
- Lowest -
- Anantapur
- Prakasam
7) Urban Population
?
- Highest
- Visakhapatnam
- Krishna
- Lowest
- Srikakulam
- Vijayanagaram
8) Rural Population
?
- Highest
- East Godavari
- Guntur
- Lowest
- Vijayanagaram
- Kadapa
9) Child population (0-6 years)
?
- Highest
- East Godavari
- Kurnool
- Lowest
- Vijayanagaram
- Srikakulam
10) Literacy - high and low
?
- Highest
- East Godavari
- Krishna
- Lowest
- Vijayanagaram
- Kurnool
11) Villages
?
- Highest
- Visakhapatnam
- Srikakulam
- Lowest
- Guntur
- West Godavari
12) Towns
?
- Highest
- Chittoor
- East Godavari
- Lowest
- Nellore
- Srikakulam & Kurnool
Urbanization in A.P
- Andhra Pradesh (AP) is rapidly urbanizing state. Urban population has grown by {{7}}% in a decade, accounting for {{30}}% of state population in 2011. This figure is expected to continue to increase to over {{43}}% in the next 15 years, contributing to an envisioned double digit economic growth that is fueled by urban growth and development. Andhra Pradesh state's Vision 2029 for urban development is to make AP cities of 2029, Productive, Inclusive, Sustainable, Smart and Well-governed. As per 2011 census {{29.47}}% of the population of A.P. living in Urban centers.
-
Some of the important features of A.P. Urbanization:
-
There are {{5409}} slums in Andhra Pradesh, comprising of {{64.5}} Lakhs people ({{44.17}}%).
- Total number of census towns in A.P - {{104}}, where as total number of status towns are - 91.
- Total number of Municpal corporations - {{16}}
- Total number of Muncipalities - {{104}}
- Total number of Nagar panchayat's - {{7}}
- Total number of contonment boards - {{1}}
- Total number of million cities - {{2 (Vishakapatnam & Vijayawada)}}
As per new districts wise population in A.P.
Important points at glance
- Out of the total population of the AP {{70.53}}% is rural and {{29.47}}% is urban population consisting.
- A.P population growth rate - {{9.21}}%
- Out of the total population of the AP {{50.08}}% is men & {{49.92}}% is Women consisting.
- Out of the total population of the AP {{17.08}}% is SC's & {{5.53}}% is ST's consisting.
- {{Guntur}} district having the largest number of SC's population and {{Vijayanagaram}} having lowest number of SC's population.
- {{Visakhapatnam}} district having the largest number of ST's population and {{Kadapa}} having lowest number of ST's population.
- {{Krishna}} district stands at 1st position in Population density ({{518}}), & {{Kadapa}} district stands at lowest position ({{188}}) in population density.
- The average literacy rate in the state is {{67.4}}%, Out of this {{74.77}}% is Men literates whereas {{59.96}}%.
- {{West Godavari}} district stands at 1st position in literacy rate, whereas {{vijayanagaram}} district stands at lowest position in this regard.
- {{Visakhapatnam}} district stands at 1st position in Urbanisation, whereas {{Srikakulam}} district stands at lowest position in this regard.
Andhra pradesh area wise
?
- anantapur - 19.13
- kurnool - 17.65
- prakasam - 17.62
- ysr kadapa -15.36
- chittoor - 15.15
- sps nellore - 13.08
- east godavari - 12.60
- guntur - 11.39
- vishakapatnam -11.16
- krishna - 8.73
- west godavari - 8.51
- vijayanagaram - 6.54
- srikakulam -5.84
highest percentage decadal growth rate :: kurnool -14.85%
lowest percentage decadal growth rate :: west godavari -3.51
rayalaseem districts
?
- chittoor
- ysr kadapa
- ananthapur
- kurnool
Geogrpahic area
?
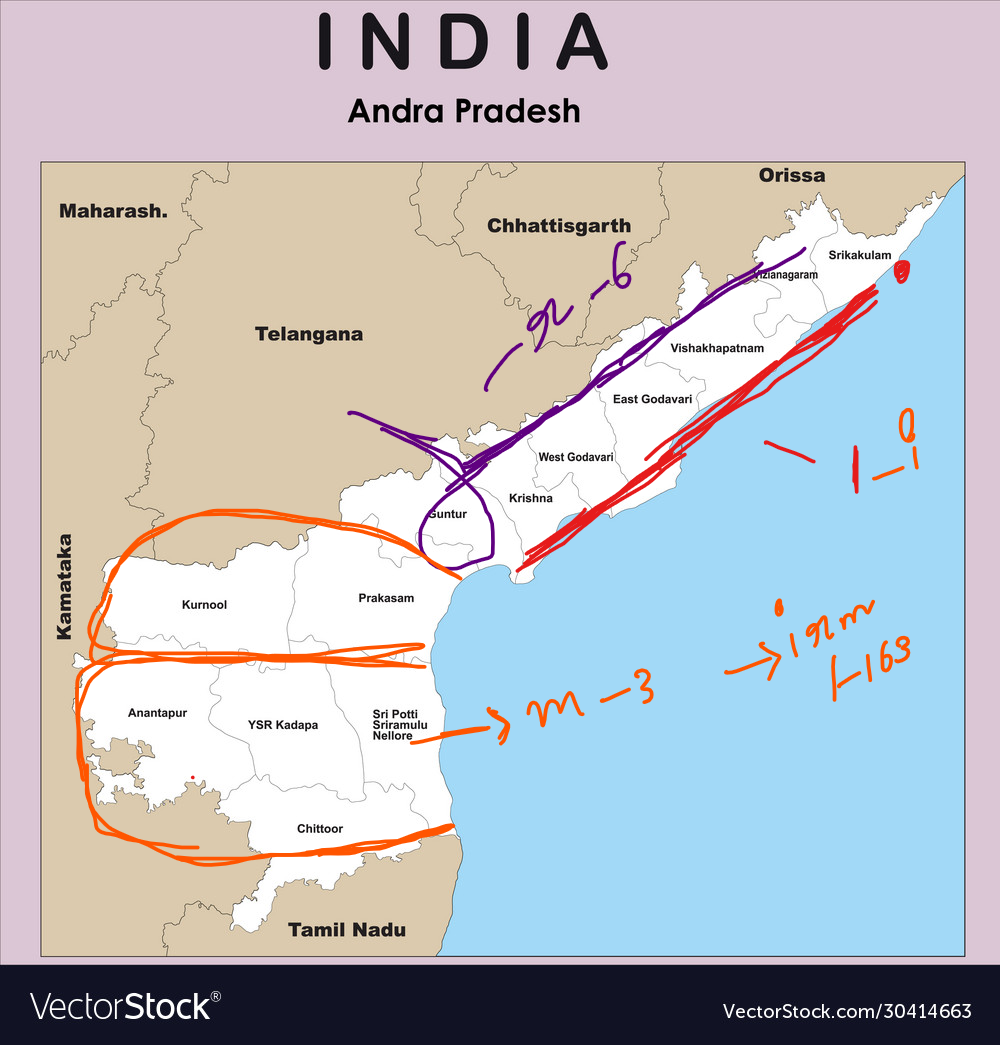
- 163 milllion sqkm
highest density :: krishana 518
sc popoulatio percentage :: 17.08%
literacy rate of ap :: 67.35 cue reading time (rt) 3 to 5
rural population :: 70.53%
rural sex ratio :: 994 cue- pranathi living in rural areas so the cue is pranathi parenting is harmful- PPH
dis high rural population :: east godavari
dis highest urban population :: vishakapatnam
child sex ratio :: 994 cue- 994 pph - pranathi parenting harmful
rural child sex ratio :: 946 CUE-946 PHR - PRANATHI HURTING RAMA
male literacy
?
-
- 77

highest male litercy district :: chitoor
urban sex ratio :: 1004
population growht rate :: except guntur all the distritcts have low growth rate than previous decade.
density :: 304
house hold :: 2.74%.
other 36.67%.
district highest population growth rate :: krunool 14%.
dis lowest sex ratio :: anantapur 977 - cue - people like mahindra started exploiting girls so the fathers afraid of girls started having boys thats why ananthapur has low sex ratio
lowest density :: ysr kadapa 118
lowest growth rate :: west godavari 3.51%
district highest sex ratio :: vijayanagaram
SC largely in which district :: prakasam 23.19
urban child sex ratio :: --------- 940. CUE- 940 -PHO- PEOPLE HAVING OBORTIONS IN URBAN AREAS
main workers :: 38.96%
marginal :: 7.59%
total workers :: 46.56%
total district population growth :: east godavari , 5285824
decadal growth rate :: 9.21%
female literacy rate
?
- 59.96 %
- cue - 59.96 - sp -pr - female sp protecting raindeer
higest literacy rate of district :: east and west godavari
sex ratio of state :: 997 cue- 997 ppr - 9 times a day sex is not good because 9 months delivery reduces to 7 months.
urban population :: 29.43%
highest growth rate :: kurnool 14.85%
st largely :: vishaka patnam
highest sex ratio :: east godavari
-
The physical charecteristics of the Indian population vary from region to region. due to the reason of since ancient times number of allien ratial groups from mediterranean central Asia, Mongolia, China, etc. Invaded India successively in different periods of histroy settle down in India and assimilated completely with local Indian people. As a result a racial admixture takes place b/w allien groups and local groups. due to this in successive generations, the people of India having shows different physical charecteristics.
-
Our census history goes back to 1872 when although a census was conducted, it is not regarded as a regular census as it was not conducted at the same time.
-
decennial censuses un- interrupted decennial censuses conducted in :: 1881 India
- The provisional figures of India's largest Census 2011 were released in New Delhi on 31st March 2011 by Union Home Secretary GK Pillai and RGI (Registrar General of India) C. Chandramouli.
The motto of census 2011 was :: "Our census, Out future'.
- Census 2011 is the:: 15th Census of India since 1872 and 7th Census after Independence.
-
According to 2011 census A.P's population is 4,95,77,103. A.P's constitutes 4.10% of india's Total population. It occupies 10th place among the highly populated state's of India. Country's Population is 121,05,69,573 (According to 2011 Census) According to 2001 Census country's population was 102,70,15,247 and United A.P population 7,57,27,541.
-
The Geographical area of the state according to 2011 Census is 163 thousand sq. kms and Density is 304. As per 2011 Census, the Density of population is highest in Krishna District with 518 persons, whereas Y.S.R Kadapa District population is the lowest with 188 person per sq.km.
-
The decadal growth rate of Population (2001-11) in the state is :: 9.21% Kurool district has the highest growth rate with 14.85% and West Godavari district has lowest with 3.51% (Excludes merged village of Khammam).
- Scheduled caste:: As per 2011 census the percentage of Scheduled caste in our state is 17.08. These people settled in some districts more than the states average. Scheduled castes population in our state is concentrated largely in Prakasam district (Percentage wise) their percentage is 23.19 in this district.
- Scheduled caste Population is predominantly concentrated in :: Guntur district. cue - gunda are mostly from sc - gunda -guntur , sc - sc
- Out of the total scheduled caste population of 84,45,398 in the state, 35,16,735 are main workers, 7,51,592 are marginal workers and 42,68,327 are total workers.
- Scheduled Tribes :: Most of scheduled tribes of A.P live in Visakhapatnam. in terms of percentage (5.53% also Visakhapatnam is the leading district.
- Kadapa is stands at last position in respect to :: ST's population.
Fact file of population in A.P
- Total population - {{4,95,77,103}}
- Total Male population :: 2,48,30,513 (50.08%)
- Total Women population :: 2,47,46,590 (49.92%)
- Total Rural population :: 3,49,66,693 (70.53%)
Total Urban population :: 1,46,10,410 (29.47%)
- Population density {{304}} (per sq.km)
-
Total child population 52,43,636 (0-6 years age)
-
Male child population 26,97,015 (0-6 years age)
-
Girl Child population 25,46,621 (0-6 years age)
4 Total literates age 2,98,59,982 ({{67.35}}%)
- Total male literates 1,65,49,514 ({{74.77}}%)
Total women literates 1,33,10,468 ({{59.96}}%)
- SC. Population :: 84,69,278 (17.08%)
- S.T. Population :: 27,40,133 (5.53%)
- Population
?
- Highest
- East Godavari
- Guntur
- lowest
- Vijayanagaram
- Srikakulam
- Population Density
?
- Highest
- Krishna
- west godavari
- Lowest
- Kadapa
- 2.prakasam
- Decadal population Growth Rate
?
- Highest
- Kurnool
- anantapuram
- Lowest
- west godavari
- 2.vijayanagaram
- Men population
?
- Highest
- East Godavari
- 2.guntur
- Lowest
- Vijayanagaram
- 2.srikakulam
- Women population
?
- Highest
-
- East Godavari
-
- guntur
-
- Lowest
-
- Vijayanagaram
- 2.srikakulam
-
- cue - women produce egg - east godavari and guntur
- Sex Ratio
?
- Highest
-
- Vijayanagaram
-
- srikakulam
-
- Lowest
-
- Anantapur
- 2.prakasam
-
- Urban Population
?
- Highest
- Visakhapatnam
- krishana
- urban population
? - Lowest
- Srikakulam
- vijayanagaram
- Rural Population
?
- Highest
-
- East Godavari
-
- 2.guntur
-
- Lowest -
-
- Vijayanagaram
- 2.kadapa
-
Child population (0-6 years)
?
- Highest
-
- East Godavari
-
- kurnool
-
- Lowest
-
- Vijayanagaram
-
- sirkakulam
-
- Literacy
?
- Highest
-
- East Godavari
-
- Lowest
-
- Vijayanagaram
-
- kurnol
-
- Villages
?
- Highest
-
- Visakhapatnam
-
- srikakulam
-
- Lowest
-
- Guntur
-
- west godavari
-
- Towns
?
- Highest
- Chittoor 2.east godavari
- Lowest
- Nellore
- srikakulam and kurnool
area sqkms
?
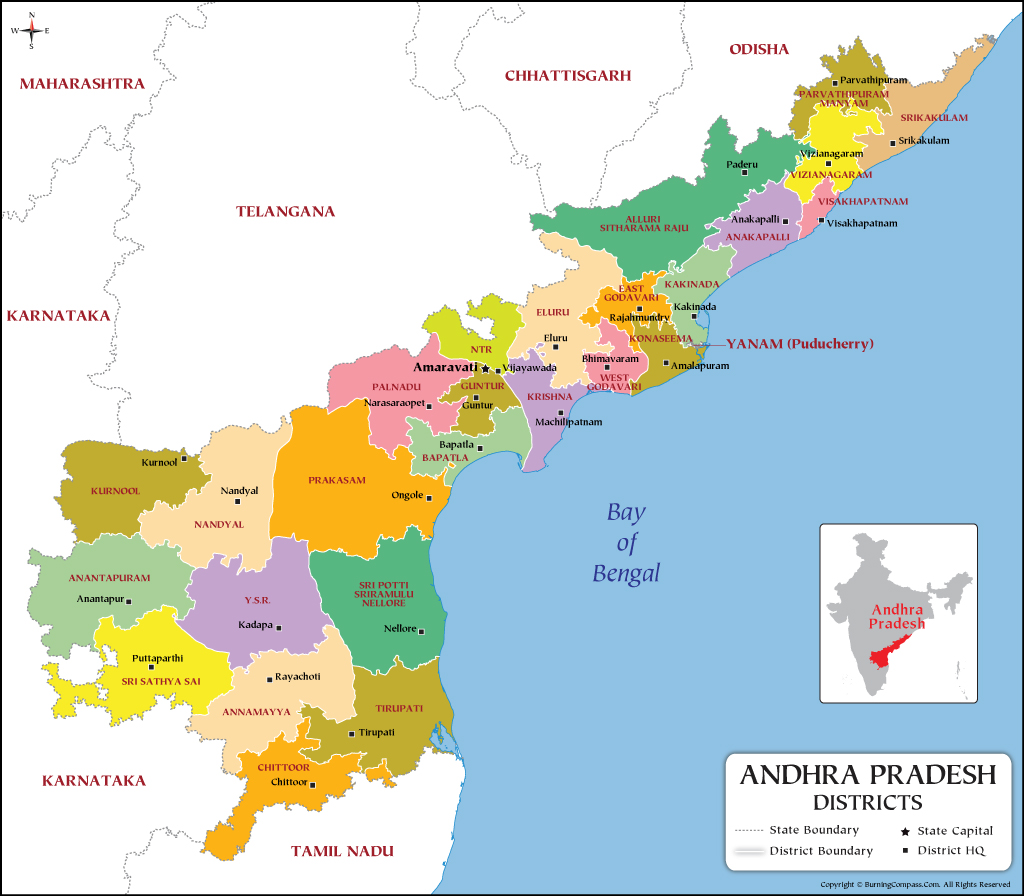
- Srikakulam - 4591
- Vizianagaram-4122
- Visakhapatnam-1048
- Anakapalli-4292
- Kakinada-3019
- Dr B.R.Ambedkar Kona Seema-2083
- East Godavari-2561
- West Godavari-2178
- Eluru-6679
- Krishna-3775
- NTR-3316
- Guntur-2443
- Bapatla-3829
- Palnadu-7298
- Prakasam-14322
- SPS Nellore-10441
- Kurnool-7980
- Nandyal-9682
- Ananthapuramu-10205
- Sri Sathyasai-8925
- YSR-11228
- Annamayya-7954
- Chittoor-6855
- Tirupati-8231
- Parvathipuram Manyam -12251
- Alluri Sitharama Raju-162967
Males
Srikakulam- 1088142
Vizianagaram - 960450
Visakhapatnam - 988393
Anakapalli - 854821
Kakinada - 1042307
Dr B.R.Ambedkar Kona Seema - 862030
East Godavari - 911520
West Godavari - 889252
Eluru - 1035066
Krishna - 869215
NTR - 11 14462
Guntur - 1042101
Bapatla - 788804
Palnadu - 1024016
Prakasam - 1 160628
SPS Nellore - 1245524
Kurnool - 1141778
Nandyal - 897449
Ananthapuramu - 1132902
Sri Sathyasai - 931593
YSR - 1037867
Annamayya - 853247
Chittoor - 939538
Tirupati - 1098515
Parvathipuram Manyam - 454623
Alluri Sitharama Raju - 466270
Total - 24830513
females
Srikakulam - 1103295
Vizianagaram-970361
Visakhapatnam-971151
Anakapalli-872177
Kakinada-1050067
Dr B.R.Ambedka Kona Seema -857063
East Godavari-920812
West Godavari-890683
Eluru-1036581
Krishna-865864
NTR-1104129
Guntur-1048974
Bapatla-798114
Palnadu-1017707
Prakasam-1127398
SPS Nellore-1224188
Kurnool-1129908
Nandyal-884328
Ananthapuramu-1108203
Sri Sathyasai-908450
YSR-1022787
Annamayya-844061
Chittoor-933413
Tirupati-1098469
Parvathipuram Manyam-470717
Alluri Sitharama Raju-487690
Total-24746590
sample
Srikakulam
Viziana aram
Visakhapatnam
Anakapalli
Kakinada
Dr B.R.Ambedkar Kona Seema
East Godavari
West Godavari
Eluru
Krishna
NTR
Guntur
Bapatla
Palnadu
Prakasam
SPS Nellore
Kurnool
Nandyal
Ananthapuramu
Sri Sathyasai
YSR
Annamayya
Chittoor
Tirupati
Parvathipuram Manyam
Alluri Sitharama Raju
Total
total population
Srikakulam - 2191437
Viziana aram - 1930811
Visakhapatnam - 1959544
Anakapalli - 1726998
Kakinada - 2092374
Dr B.R.Ambedkar Kona Seema - 1719093
East Godavari - 1832332
West Godavari - 1779935
Eluru - 2071647
Krishna -1735079
NTR - 2218591
Guntur - 2091075
Bapatla - 1586918
Palnadu - 2041723
Prakasam - 2288026
SPS Nellore - 2469712
Kurnool - 2271686
Nandyal - 1781777
Ananthapuramu - 2241 105
Sri Sathyasai - 1840043
YSR - 2060654
Annamayya - 1697308
Chittoor - 1872951
Tirupati - 2196984
Parvathipuram Manyam 925340
Alluri Sitharama Raju - 953960
Total - 49577103